 International
 Singapore
 Malaysia
 Thailand
 Vietnam
Your shopping cart is empty!

Create Datalogger for Sending Data to Google Sheets with IRIV
- Abdulrahman Alhamed
- 30 Nov 2023
- Tutorial
- Advanced
- 635
In today's industrial sector, there is a growing need for devices capable of recording various system data, whether it's the operation of machinery or environmental conditions such as temperature and humidity. This is driven by various reasons, including quality control, ensuring safety, and providing convenience for users. These devices should not only assist in maintaining control and quality but also facilitate user convenience from installation to recording, making it easy to read, understand, and analyze the gathered data for practical utilization.

Image by usertrmk on Freepik
Therefore, in this article, let's explore creating a Datalogger system for monitoring and recording temperature and humidity data from industrial-grade sensors using the RS485 interface. We'll achieve this by utilizing the IRIV PiControl as a device to read data from the sensor, process the received information, and then transmit the data to various destinations. This includes sending data for logging onto a Google Sheet with timestamp information, displaying real-time data on the Node-RED Dashboard, and triggering alerts when the system's temperature exceeds the user-defined threshold set on the Dashboard.

IRIV PiControl
Step 1: Prepare the Node-RED Flow
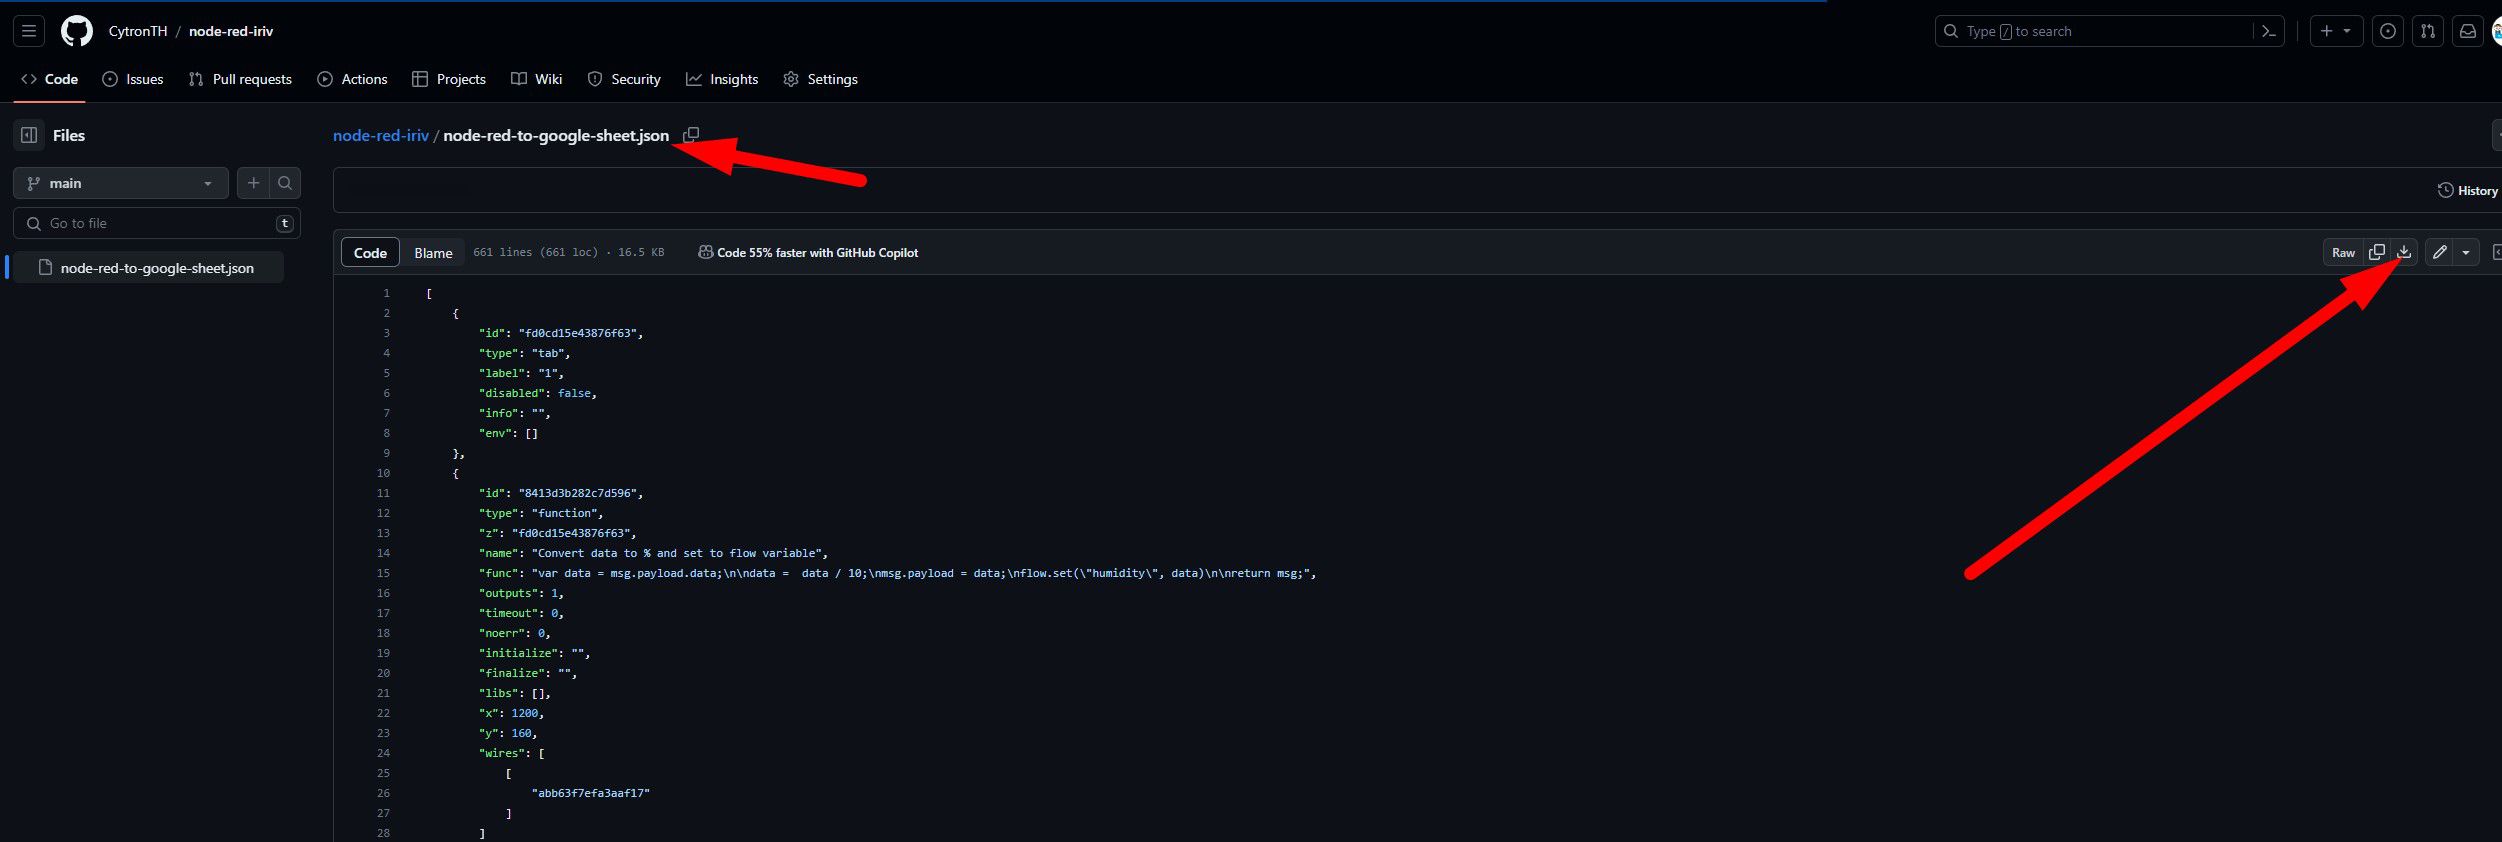
1. For a quick start in building this project, you can download the prepared Node-RED flow by clicking here.
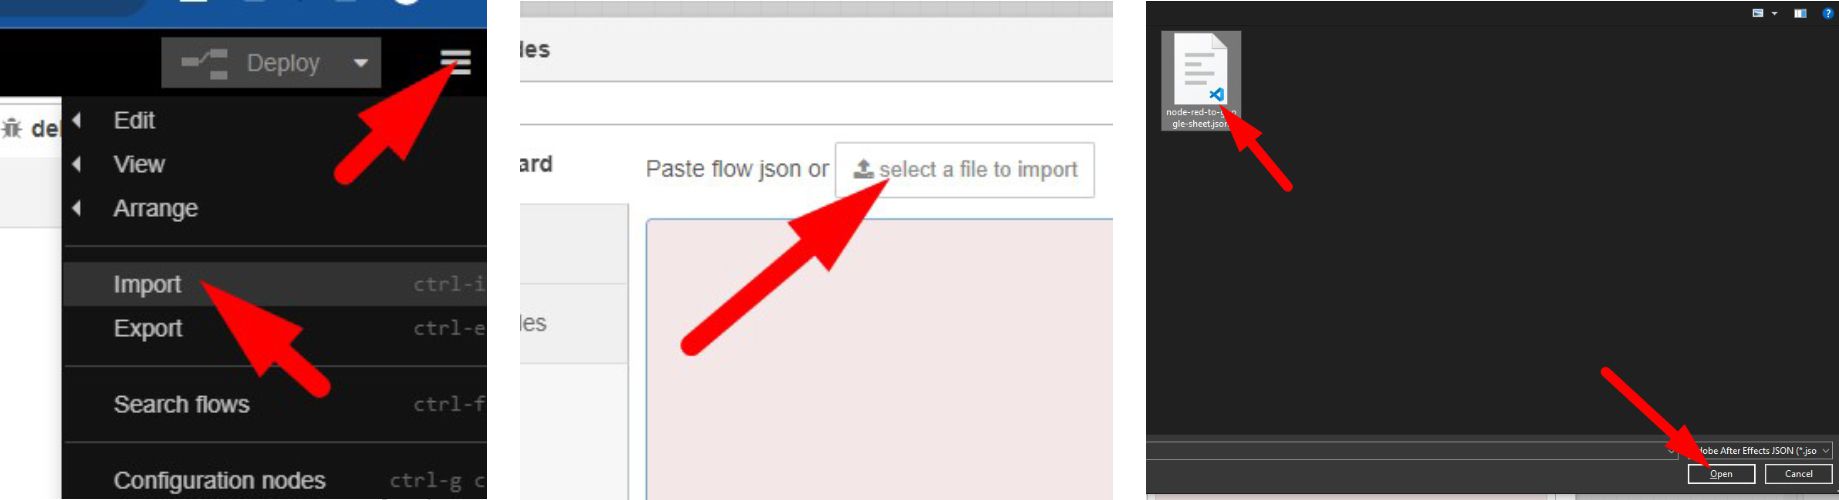
2. After successfully downloading it, in the Node-RED flow editor, click on the three-line icon at the upper right corner. Select "Import" and click on the "Select a file to import" button. Choose the downloaded flow file with the .json extension and click "Open" to upload it. Afterward, click the "Import" button.
Once the upload is complete, you may notice that some nodes show errors. To resolve this, download the necessary nodes by going to the three-line icon again, selecting "Manage palette," and then choosing the "install" tab.

Install the following nodes from the list to ensure that the downloaded flow functions correctly:
- node-red-dashboard
- node-red-contrib-moment
- node-red-contrib-modbus
- node-red-contrib-line-notify-api
- node-trd-contrib-google-sheets
After downloading is complete, the nodes should not display any issues.
Step 2: Understanding the Flow and Configuring the Flow
From the image below, this flow is divided into 5 main groups:
- Sensor Data Reading Group
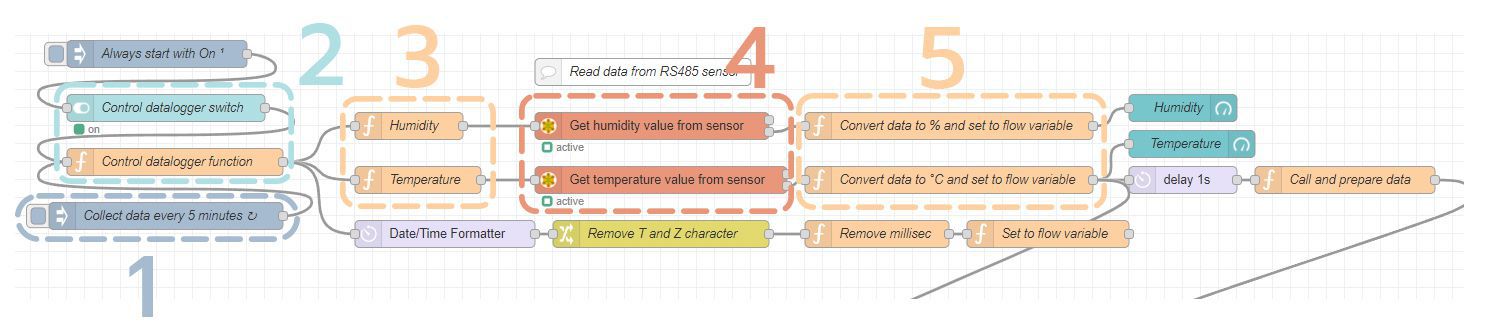
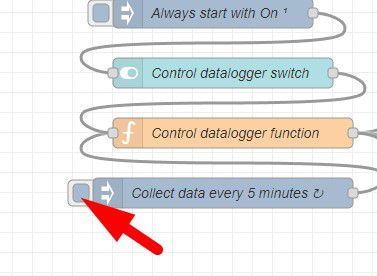
1. This group starts with the use of the Inject node to command the system to read values from the connected sensor. Users can adjust the interval for reading sensor values at this node.
2. The Switch node and Control datalogger function (function node) serve as nodes to control the commands from the Inject node. When the switch in the dashboard is in the "On" position, it allows the Inject node to command the system to read values from the sensor. Conversely, when the switch is in the "Off" position, it prevents the Inject node from commanding the system to read values from the sensor, effectively pausing the entire system.
3. The Humidity and Temperature function node specifies the necessary variables for reading values from the connected sensor.
4. The Get humidity value from sensor (modbus flex getter node) reads values from the sensor based on the variables received from the previous function node.
5. The Convert data to °C and set to flow variable and Convert data to % and set to flow variable (function nodes) convert the sensor data to accurate values (divide the sensor values by 10) and send the read values to flow variables for comparison with the thresholds set on the dashboard.
- Data Preparation Group for Google Sheet Writing
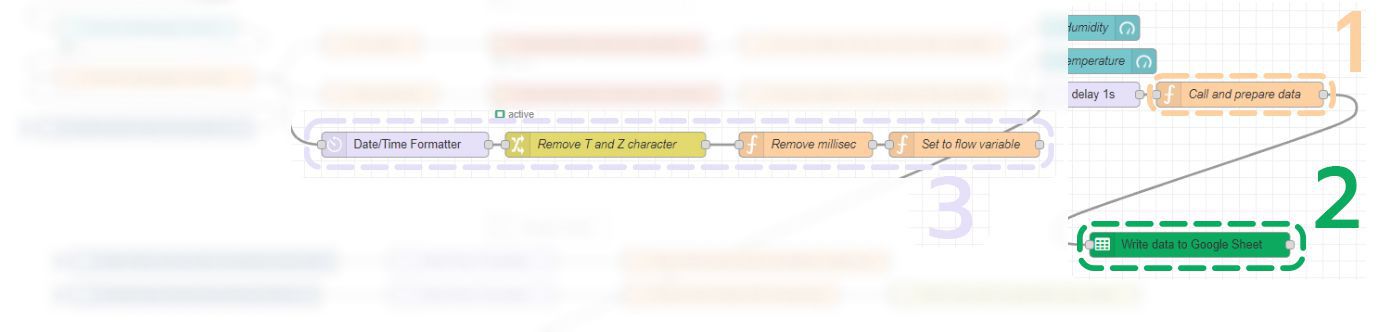
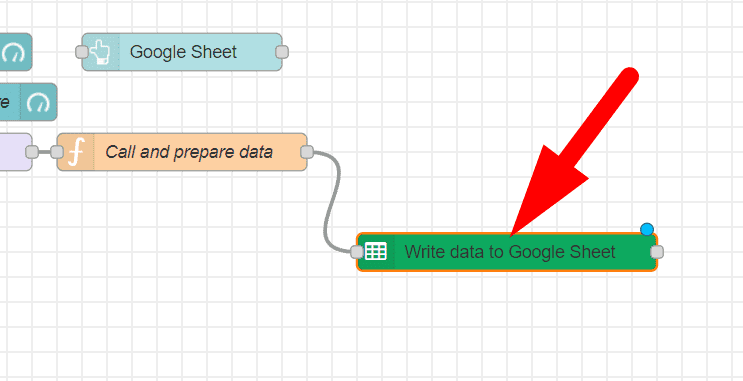
1. Start with Call and Prepare Data (Function Node): This node consolidates all the data obtained at that specific time, arranging them in an array to be sent for writing on Google Sheet. (The position of the data in the array corresponds to the column where the data will be written.)
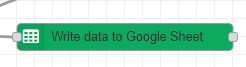
2. Write Data to Google Sheet (Gsheet Node): This node is responsible for sending data to be written on the Google Sheet as specified by the user, following the designated read-write method for Google Sheet.
3. Date/Time Formatter (Date/Time Formatter Node): Converts Epoch time format to human-readable time. Afterward, it removes the "T" and "Z" characters using the Remove T and Z character (Change Node) and eliminates the time in milliseconds using the Remove millisec and set to flow (Function Node) (internally utilizing .slice(), one of the functions for character trimming in JavaScript). Finally, it sends the obtained values to the flow variable, ready to be called for writing on Google Sheet in the previous step (Call and Prepare Data (Function Node)).
- Automatically Creating a New Sheet Every Midnight

1. Create New Sheet Every Day at 00:00 (Inject Node): This node commands the creation of a new sheet every midnight (adjustable) by triggering the process.
2. Use the Date of the New Day as the Sheet Name (Year-Month-Day): Utilizing the Date/Time Formatter (Date/Time Formatter node), the node transforms the epoch time at that moment into a human-readable timestamp (Year-Month-Day) to be used as the name of the new sheet.
3. Name New Sheet with Timestamp (Function Node): This node assembles the characters to name the new sheet using the data obtained from the preceding node (Date/Time Formatter node). It also establishes the URL for calling the API we've created for Google Sheet, enabling the automatic creation of a new sheet.
4. Send HTTP Request (HTTP Request Node): Initiates an HTTP request using the variables from the previous node (Name new sheet with timestamp (Function Node)).
* For the creation of a Google Sheet, Service Account, and enabling the Google Sheet API for use with this project, please refer to the concluding section of this article.
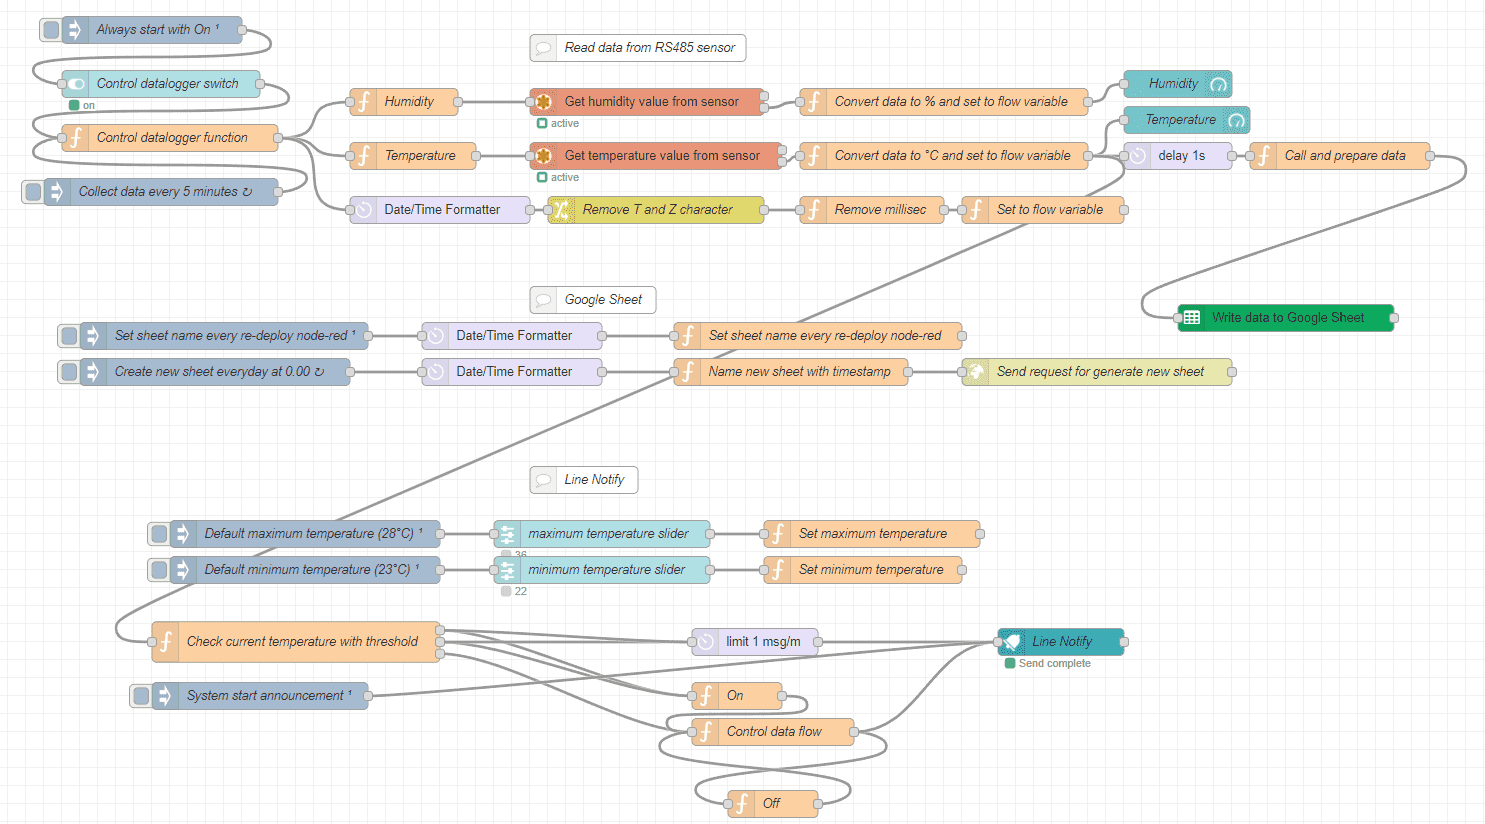
- Dashboard Section for Display and Threshold Configuration
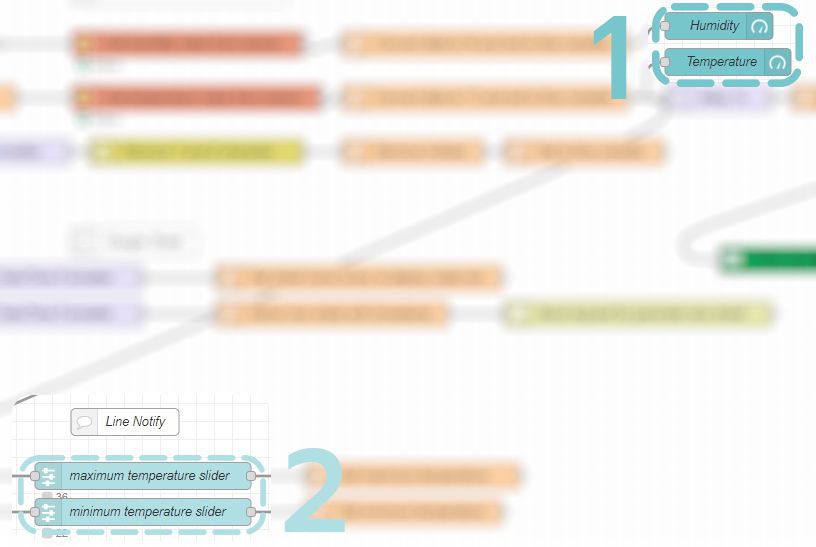
1. Temperature and Humidity (Gauge Node): Displays real-time sensor data on the Node-RED Dashboard.
2. Maximum Temperature Slider and Minimum Temperature Slider (Slider Node): Allows users to set the acceptable range for maximum and minimum temperatures. This configuration is used before triggering Line notifications when the values exceed the specified thresholds.
- Line Notify Notification Section
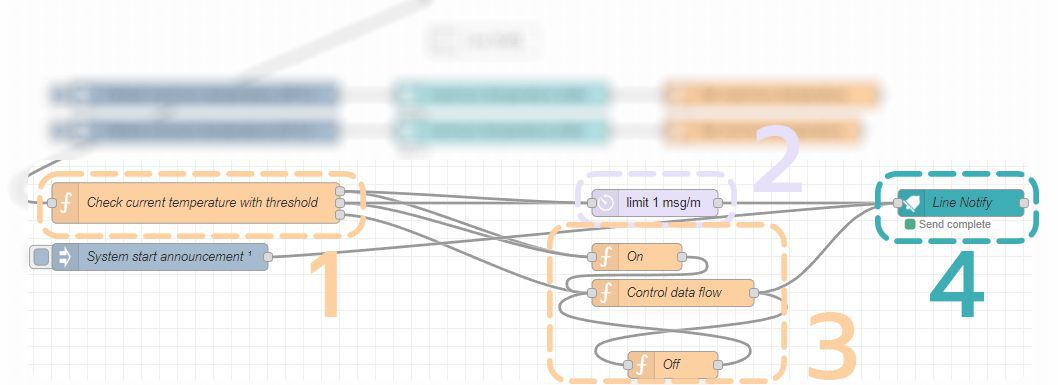
1. Check Current Temperature with Threshold (Function Node): Retrieves the current sensor data and compares it with the acceptable temperature range set on the Node-RED Dashboard. If it falls within a certain threshold, it sends a message to the next node (Line Notify Node) for user notification.
2. In the case where the current temperature exceeds or falls below the configured value: Sends a pre-configured message to the Line Notify Node for notification. A delay node is implemented to prevent frequent notifications.
3. When the temperature returns to the specified range: Sends a final notification stating that the system has returned to normal. A control data flow (Function Node) is used to prevent repetitive notifications.
4. Line Notify (Line Notify Node): Sends various data to the Line Notify system. Users need to specify their Line Notify Token. Visit this link. The information sent through this node includes the prepared message and the sticker ID to be sent along with the message.
Configuration Settings for Users:
- For the Sensor Data Reading Group: Due to variations in variable values for each sensor type, users need to configure parameters for reading data from the respective sensors.

- Call and Prepare Data (Function Node): Since the data variables to be written to Google Sheet may differ, including the arrangement of data columns on Google Sheet, users should customize this node accordingly.

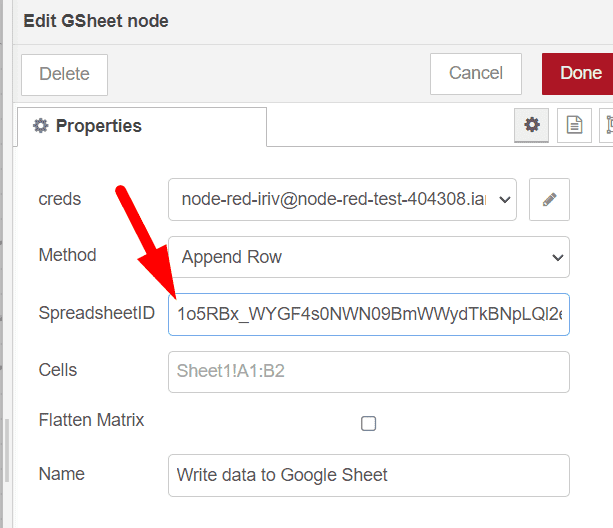
- Write Data to Google Sheet (Gsheet Node): As users have different .json files for the gauth node and unique SpreadsheetIDs, customization is required.
- Name New Sheet with Timestamp (Function Node): The msg.url part for the HTTP request to trigger the Google App Script API may have different URLs depending on the system-generated URL.

- Line Notify (Line Notify Node): As each user has a unique Line Notify Token provided by the Line Notify system (Learn how to obtain a Line Notify Token here), users need to personalize this node accordingly.

Step 3: Create a Google Sheet for Integration with the System
1. Create a Google Sheet as usual. After obtaining an empty Google Sheet, copy the SpreadsheetID by observing the link at the top of the page, resembling the example below. Copy from the character after /d to the character before /edit, then paste the obtained SpreadsheetID into the Gsheet node in the SpreadsheetID field.
Example:
https://docs.google.com/spreadsheets/d/1o5RBx_WYGF4s0NWN09BmWWydTkBsdfsfQl2exresgrdZ8/edit#gid=202324439
2. Generate a Service Account to allow Node-RED to write data on Google Sheet. You can create it here. Upon accessing, click on "Create a project" on the resulting page.

Name the project and then click on "Create."

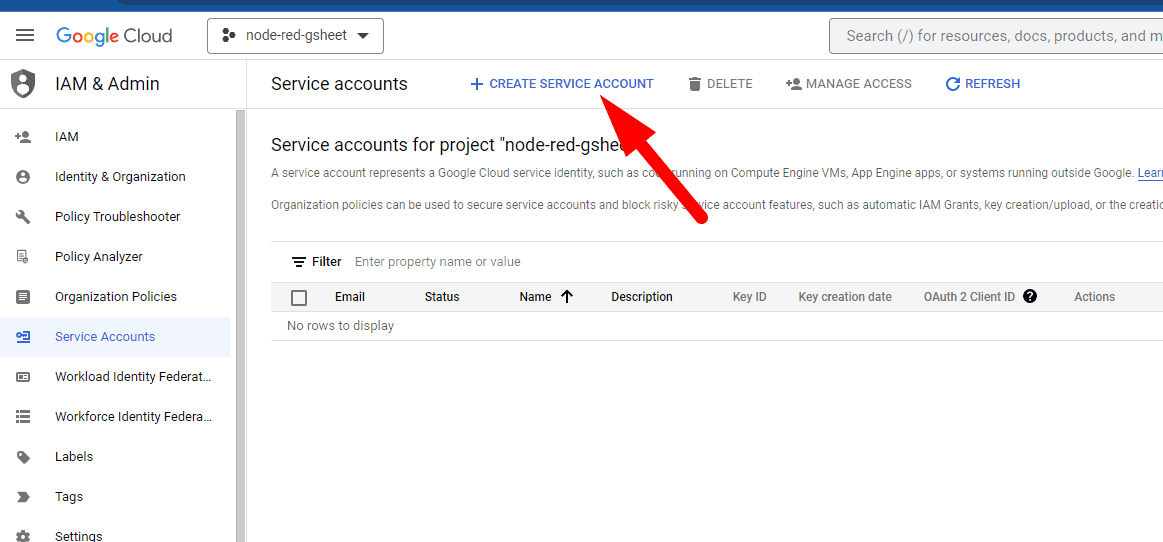
3. After completing the project creation, you will encounter this page. Click on "Create service account."
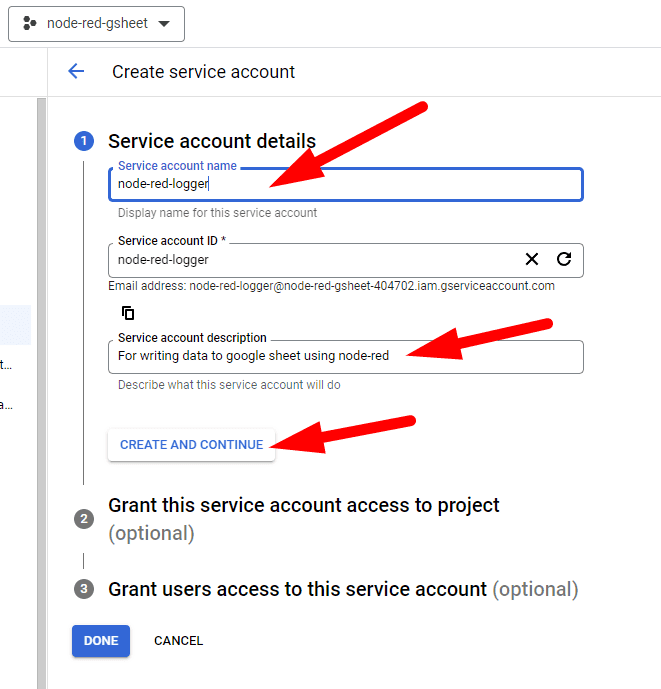
4. Name the service account and provide a description of its usage. Then, click "Create and continue."
5. Choose "Owner" as the role for the service account and click "Continue."
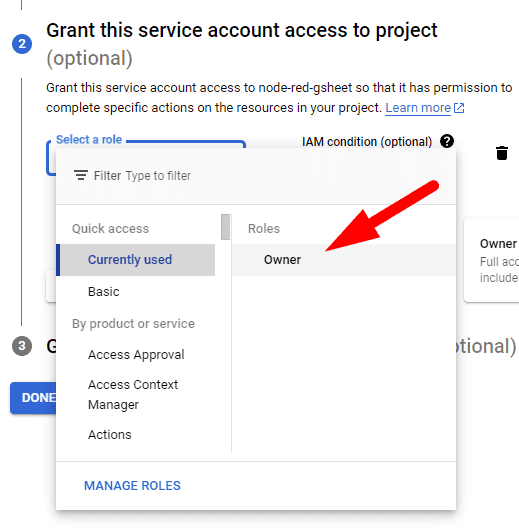
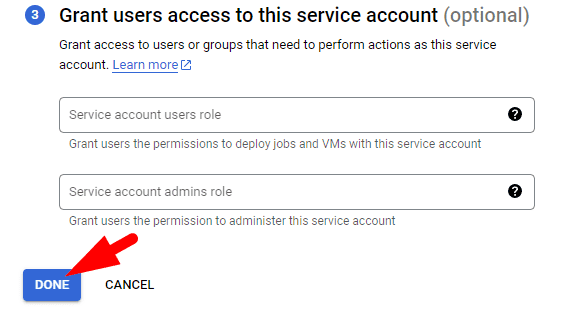
In this section, no input is required. You can click "Done."
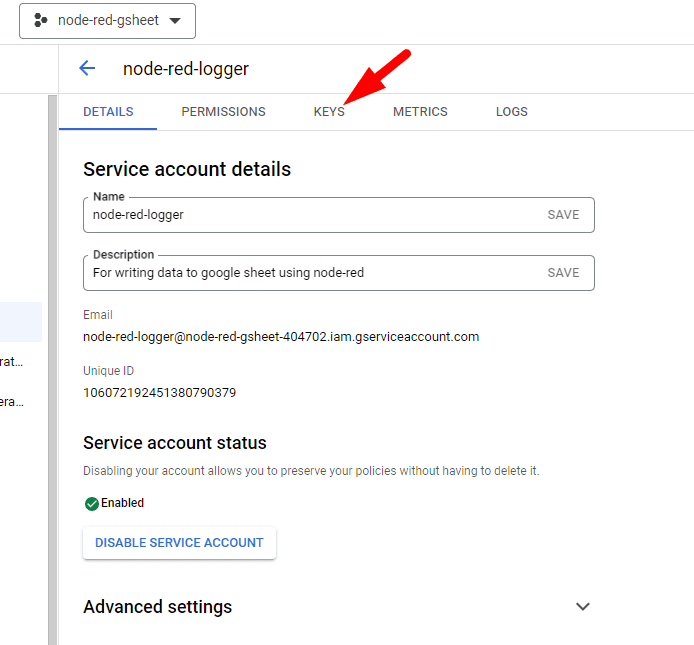
Once completed, you will have the service account for writing data to Google Sheet. Next, we will create a key to allow Node-RED to access this service account. Click on the service account you created by clicking on the email address of the service account.

6. Click on the "Keys" tab.
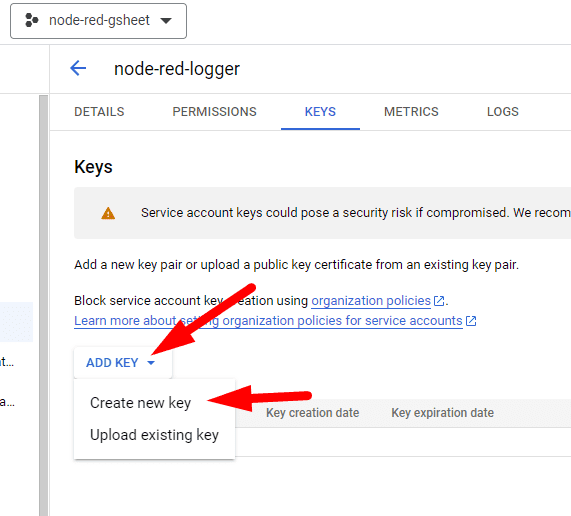
7.Click on "Add key" and select "Create new key."
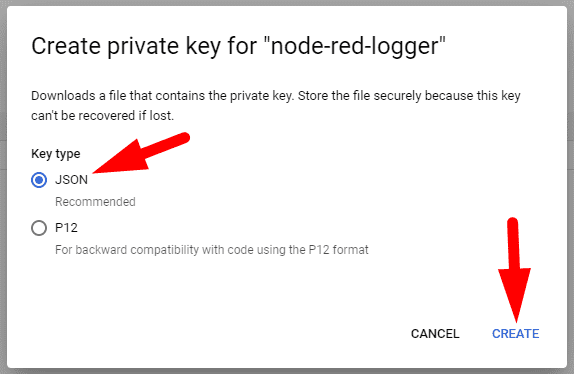
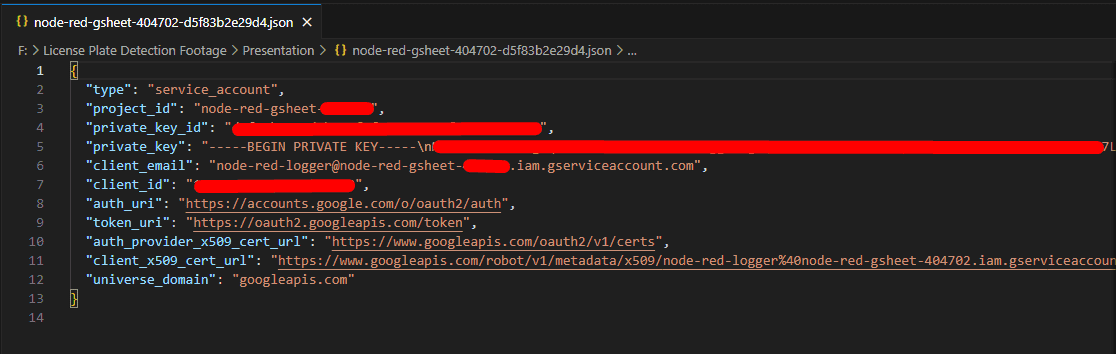
8. Choose the key type as JSON and click "Create." The system will automatically download the key to your computer.

9. Go back to Node-RED, select the Gsheet node, and in the "creds" section, choose "Add new gauth…." Then, click on the pencil icon at the back.
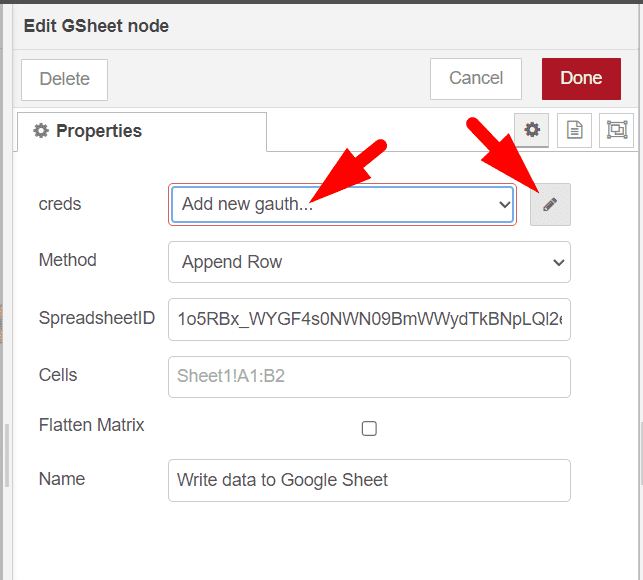
10. Open the JSON key file you downloaded earlier, copy all the text, paste it into this field, and click "Update."

Just like that, in the Node-RED section, it is now ready to operate.
11. Go ahead and enable the Google Sheet API by clicking on this link and then click Enable.

*Make sure that the project we want to enable the API for is the correct one, and it should be the project we created earlier.
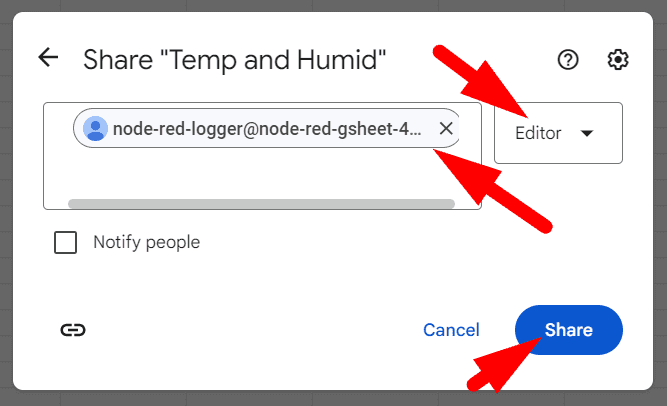
12. Go back to the Service account, click on Copy to clipboard.

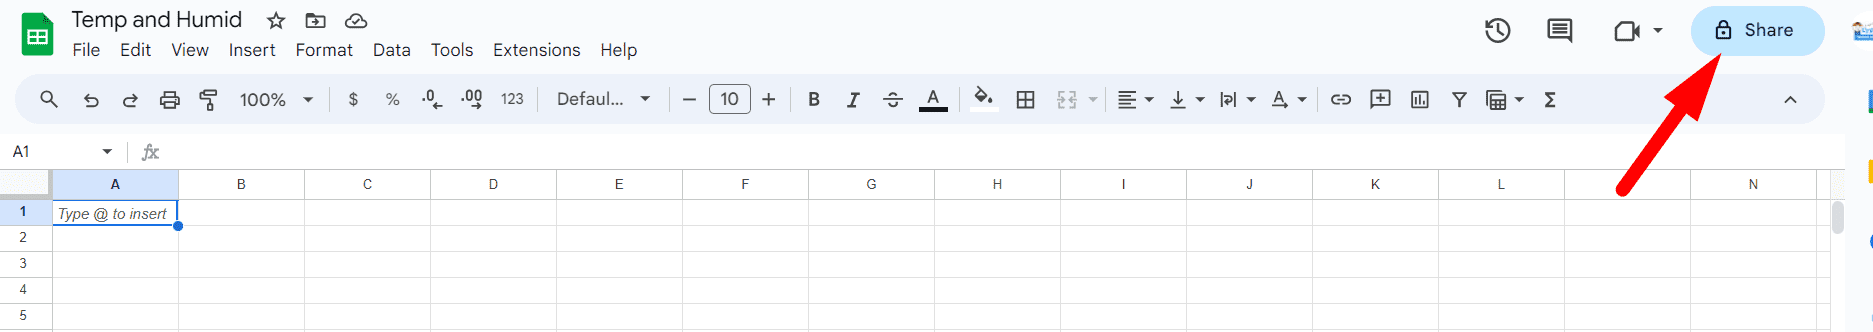
13. Open the Google Sheet that you created, click on the Share button, and add the Service account to the "Add people and groups" field. Choose the role as Editor and click Share.
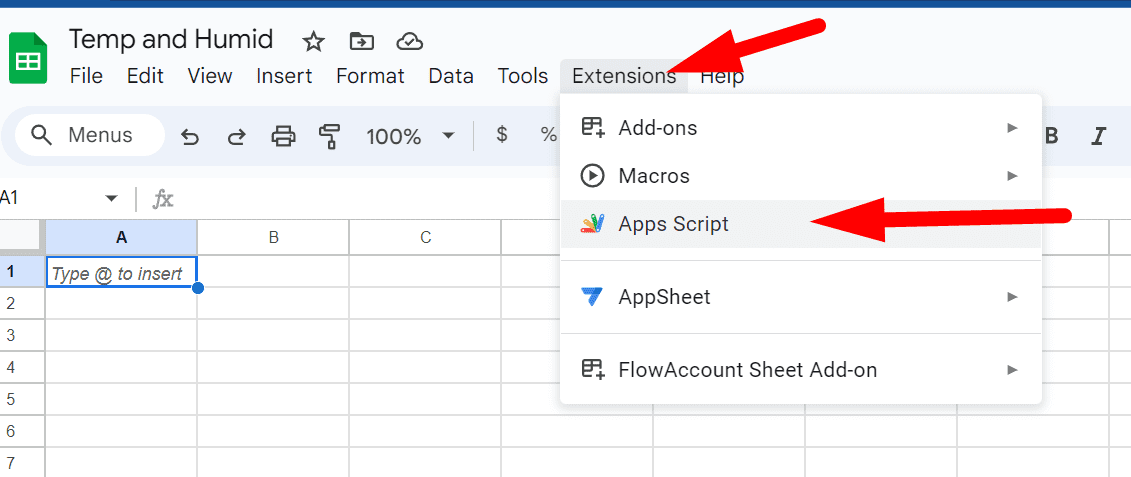
14. Write a Google App Script to create a new sheet every midnight using Node-RED. Go to Google Sheet, select Extension > Apps Script.
15. Rename the script to create_new_sheet.gs and copy the prepared script. Paste it and click Save.

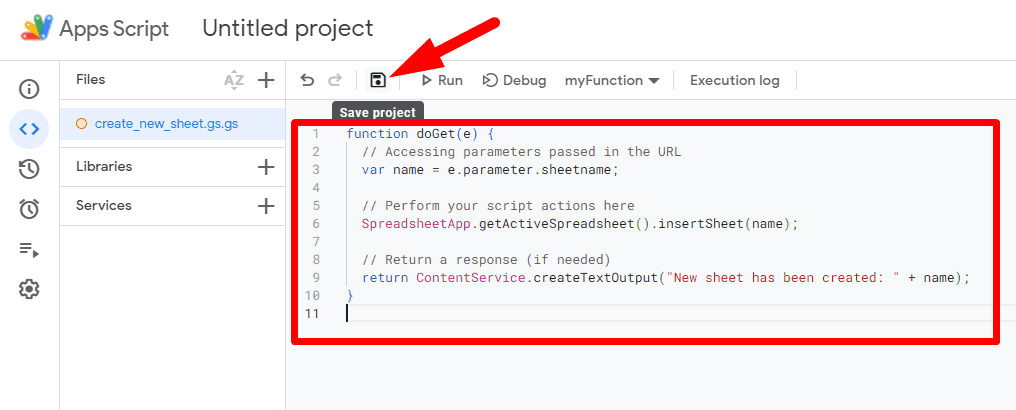
function doGet(e) {
// Accessing parameters passed in the URL
var name = e.parameter.sheetname;
// Perform your script actions here
SpreadsheetApp.getActiveSpreadsheet().insertSheet(name);
// Return a response (if needed)
return ContentService.createTextOutput("New sheet has been created: " + name);
}
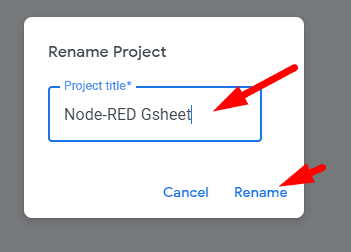
16. Click on the project name to set the name.

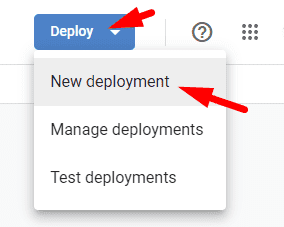
17. Click Deploy and choose New deployment.
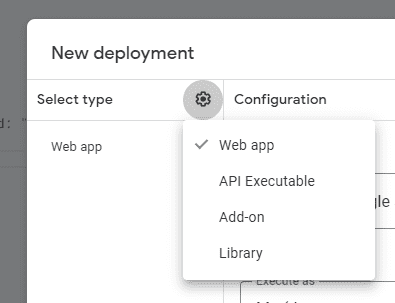
18. Select the type as Web app.
19. Fill in the remaining information. In the "Who has access" section, choose Anyone. After that, click Deploy.

20. After a successful deployment, you will get a Web app link. Copy and save it. Then, click Done to close this page.

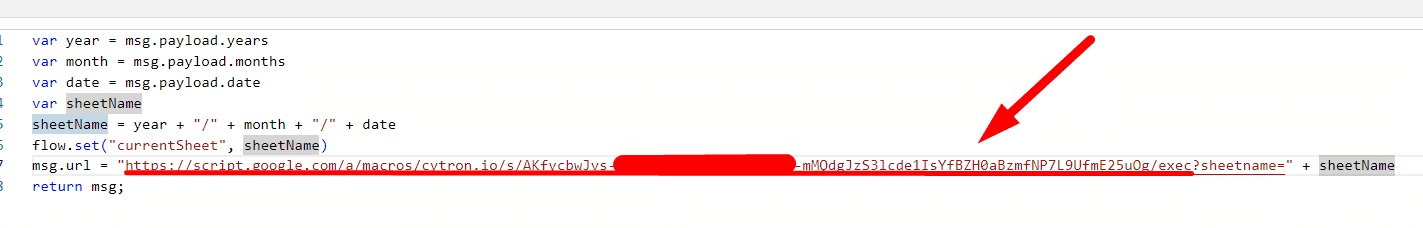
21. Go back to Node-RED, select Name new sheet with timestamp (function node), paste the copied link into the msg.url section, and click Done to save.

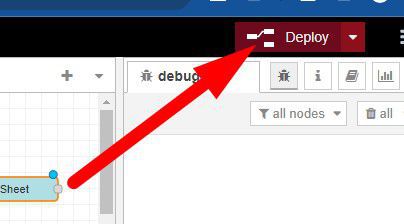
22. Click Deploy (Full).
23. If the system operates successfully, you will receive a notification via Line Notify.

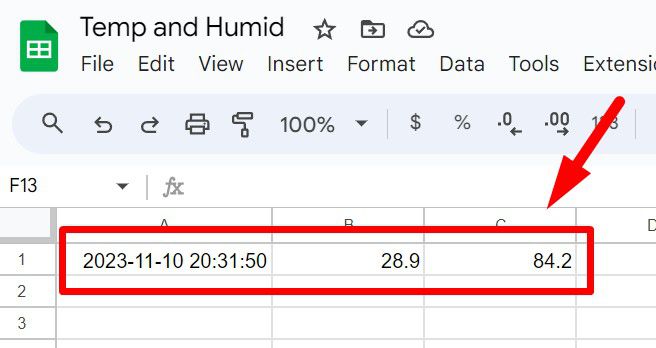
If you test by clicking the Inject Node, you will find that the data is written to the Google Sheet that we have created.
With the diverse capabilities of Node-RED installed and operational on IRIV PiControl, you can easily enhance all your IoT projects.
For further details about this project or IRIV PiControl, you can inquire through the following channels:
Email: support@cytron.io
Chat with us: m.me/cytrontech
Hardware Components

IRIV PiControl - IR4.0 CM4 Industrial Controller
RM1,345.00++
x 1 unit(s)
Related Posts
